Yesterday we asked, “Are tablets turning us more into consumers than creators?” Continuing that theme, here’s how comScore’s data suggests US tablet owners use their devices.
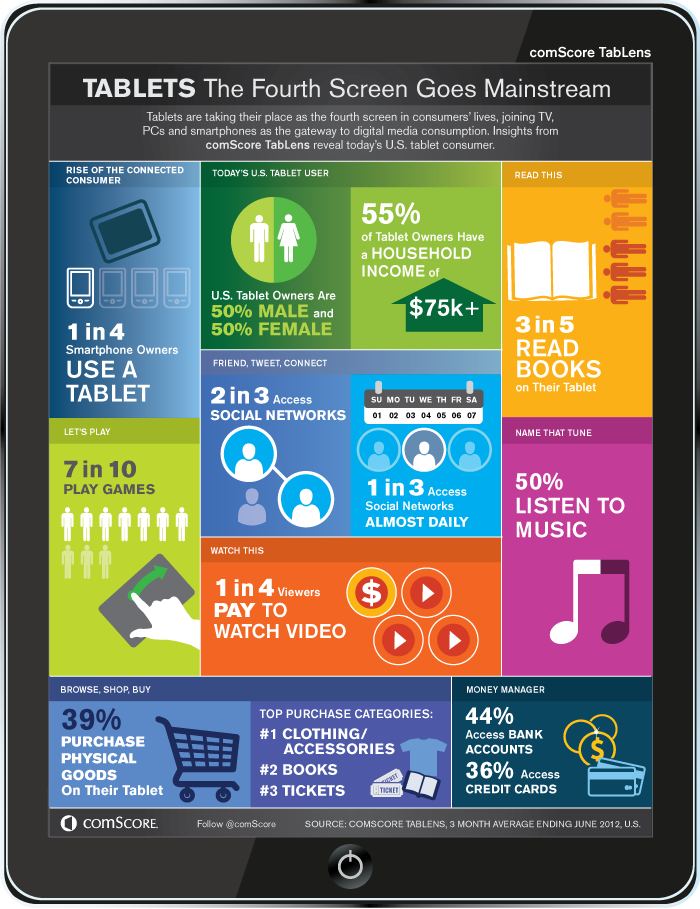
We play more than we read and while we might be social, it’s not as often as you might think, that’s what this infographic released by comScore’s Teblens suggests.
The infographic is based on a study that analysed data from 6,000 users over three months, finishing in June 2012; just a month before the release of Google’s bestselling Nexus 7 tablet. The data reports that in the US tablet ownership is split evenly between men and women and about 55% of these have a higher than average household income (of over $75k).
So, what does the data say? The average US tablet user is more likely to spend their time playing games (7 out of every 10 users) than reading (6 out of every 10). Very few users, about 25%, have paid to watch video online. But while tablet users like to play and read only 50% listen to music via their tablet.
As for social networking, 2 out of every 3 tablet users access social networking sites but only 33% of tablet users access these every day – although the data doesn’t say how long users spend on their social networks.
It would seem that only a few users are comfortable making purchases using their tablets. Along with the 25% of users that have paid to watch video on their tablets only 39% have purchased physical goods. Some 44% access their bank accounts via their tablet but only 36% access their credit card data.
In business terms tablets are still in the early adopter stage, meaning the market still has a long way to go before the market matures but comScore’s data gives us a fascinating insight into how we are currently using our new gadgets.


