

Americans are not the most reserved when it comes to slamming down watery light-beer, but here is a beautiful infographic on how they like to get sloshed.
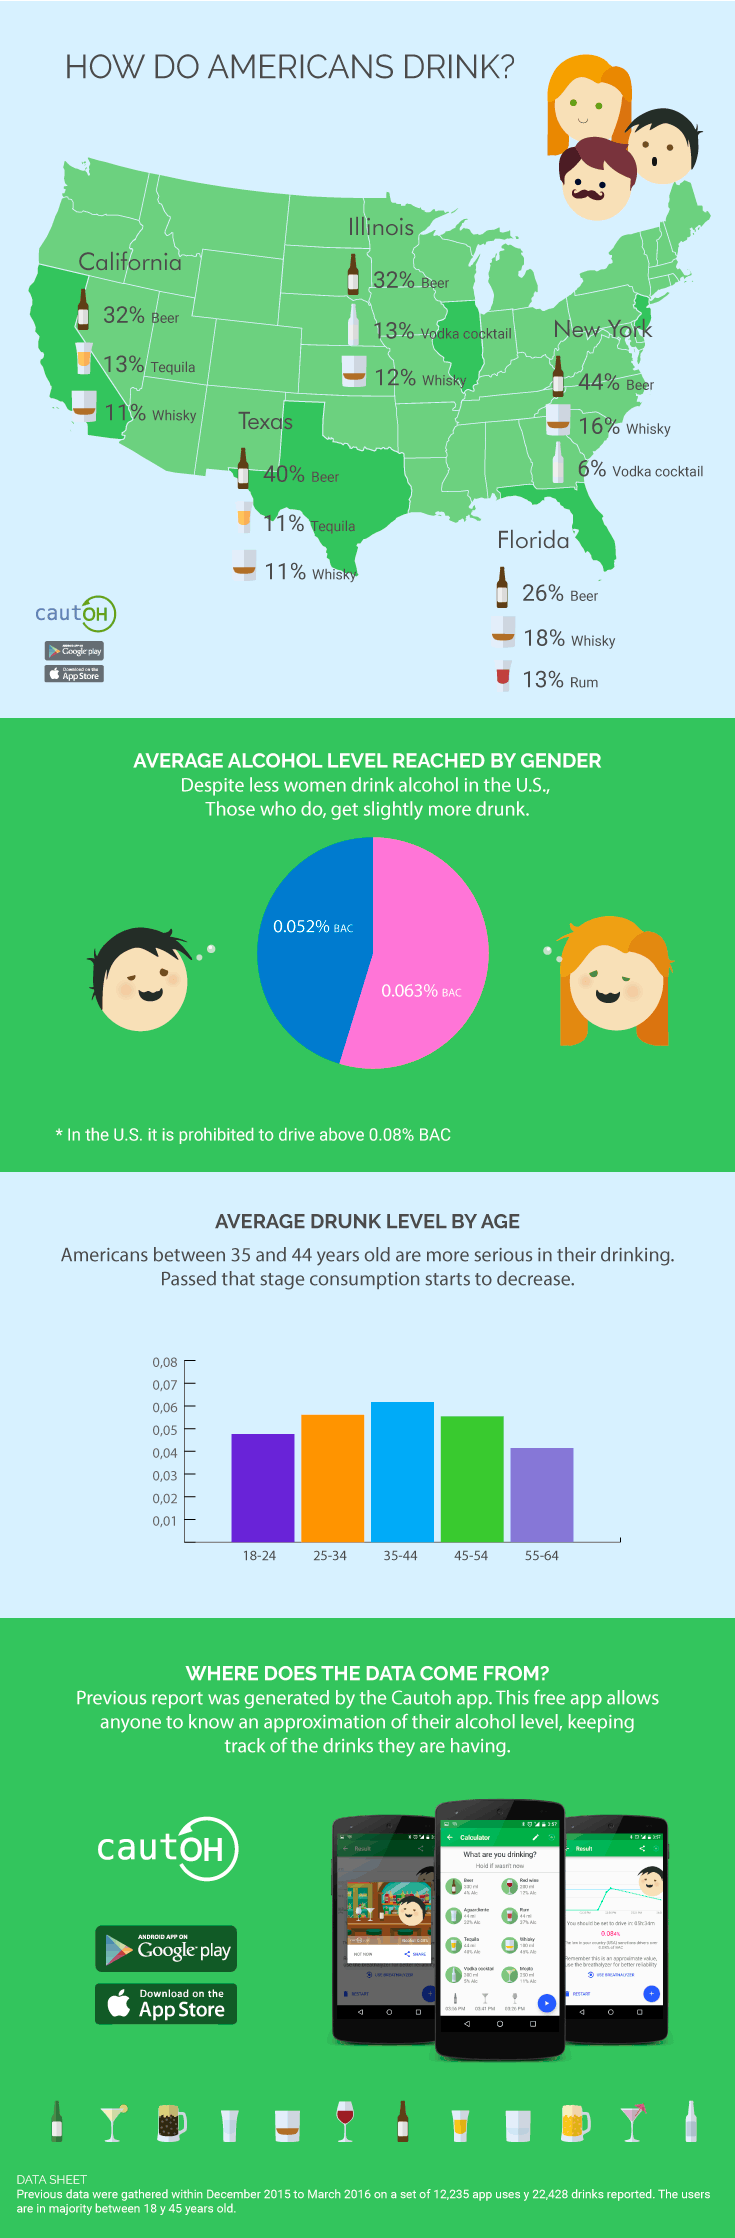
A free app for drinking tracking and alcohol level estimation has released its latest infographic: How do Americans drink?
The infographic by Cautoh starts with a breakdown of the most popular drinks in each state, for example beer and whiskey are the preferred drinks in America — they appear in all the charts, and despite the popularity of wine it seems that their consumption is not so widely spread as with the other drinks.
The second part display blood alcohol content on average by gender and by age showing that women despite their lower consumption, reach slightly higher alcohol levels than men. This is due to having less body mass generally.
“Drinking is surrounded with lots of myths and false beliefs, and that causes fatalities, our purpose is to bring proper info to the world so people can be smart drinkers,” said Leon Hernandez, CEO of Cautoh.
“Our infographic shows actual information provided by users around America, we are preparing and developing more features to assist them properly and be more than just an alcohol tracker app” added Daniel Cano, CTO of the company.