2012’s US Presidential Election is set to become the first real time online election the country, and the world, has seen; if the number of interactive news sites’ real time election graphics are any judge.
Most of the major national and international news sites are hosting some form of real time election count trackers this year. All of them are hoping to be the first to call this Presidential Election before the others (and hoping to avoid incorrect calls, as in some previous years).
Here are some of the best,
Reuters and Ipsos have launched an interactive map designed to show how each of the US States are expected to vote, according to the latest exit poll data.
Reuters says of the latest data;
“The latest Reuters/Ipsos national poll of likely voters, a daily tracking poll, gave Obama a slight edge, with 48 percent support compared to Romney’s 46 percent. The difference was within the 3.4 percentage point credibility interval, which allows for statistical variation in Internet-based polls.”
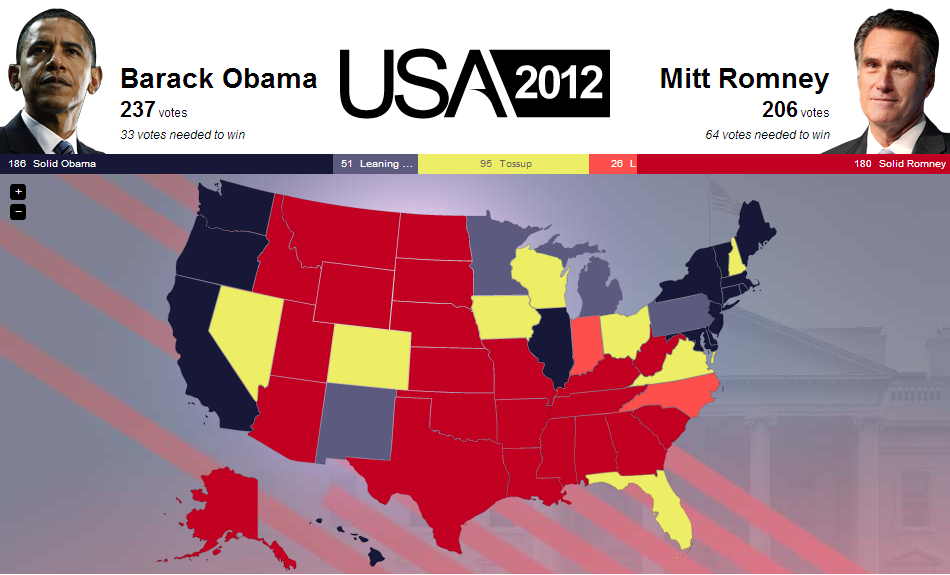
Euronews’ impressive interactive map and swing-o-meter lets users create their “own scenario of Election Day” in real time as the votes are counted by clicking on individual states. The site reports that Obama needs 33 Electoral College votes to take the White House, Romney needs 64 and 95 individual Electoral College votes are a “tossup” between the candidates
“Barack Obama leads, according to polls, in the states represented in blue on the map. Similarly, Mitt Romney leads in the ones in red. ‘Swing states’ are represented in yellow. In these states neither candidate has overwhelming support to secure their electoral college votes. Winning one of these states could, therefore, be decisive.”
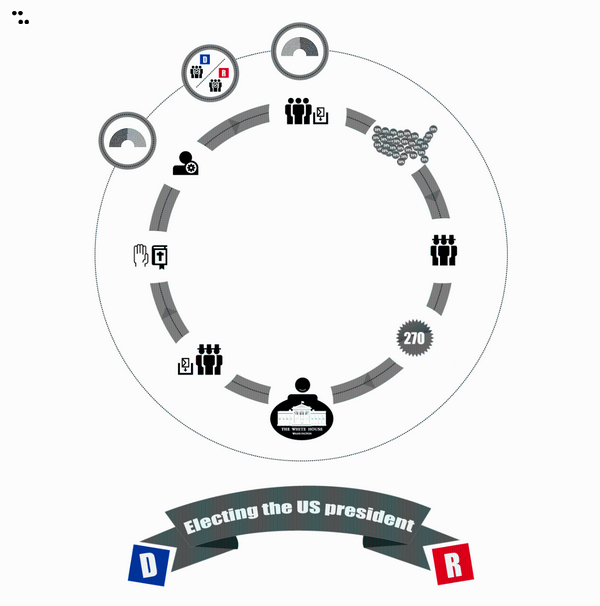
Euronews has also produced an interactive infographic explaining how the US electoral system works.
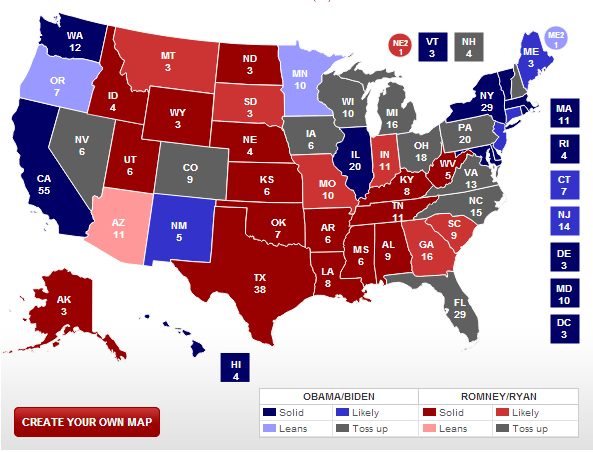
Real Clear Politics shows a detailed breakdown of the Presidential Election by state, showing solid Republican or Democrat states as well as likely and leaning states.
The site has also collated the most recent polls and statistics showing which candidate is coming out on top and by what percentage.
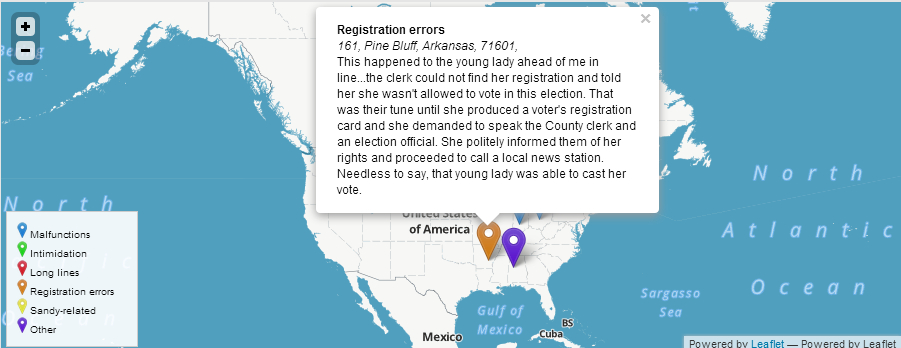
Meanwhile, The Daily Beast has produced a web app to help American voters report any problems they have had at the ballot this year.
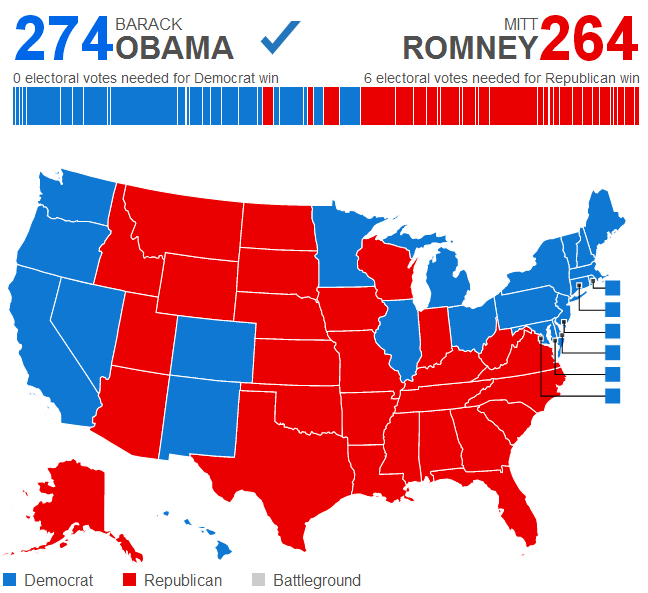
In the UK the BBC is asking the public to predict the winning candidate in their interactive map of the US Elections. Asking their own pundits, the Corporation’s map predicts 274 Electoral College votes will go to Obama and 263 to Romney. They say,
“Turn-out is really hard to forecast, simply because many people don’t decide whether or not to get off the couch until the big day itself. ”
The BBC is going one better than Real Clear Politics and has produced an interactive poll of polls showing each candidate’s popularity over the past seven months.
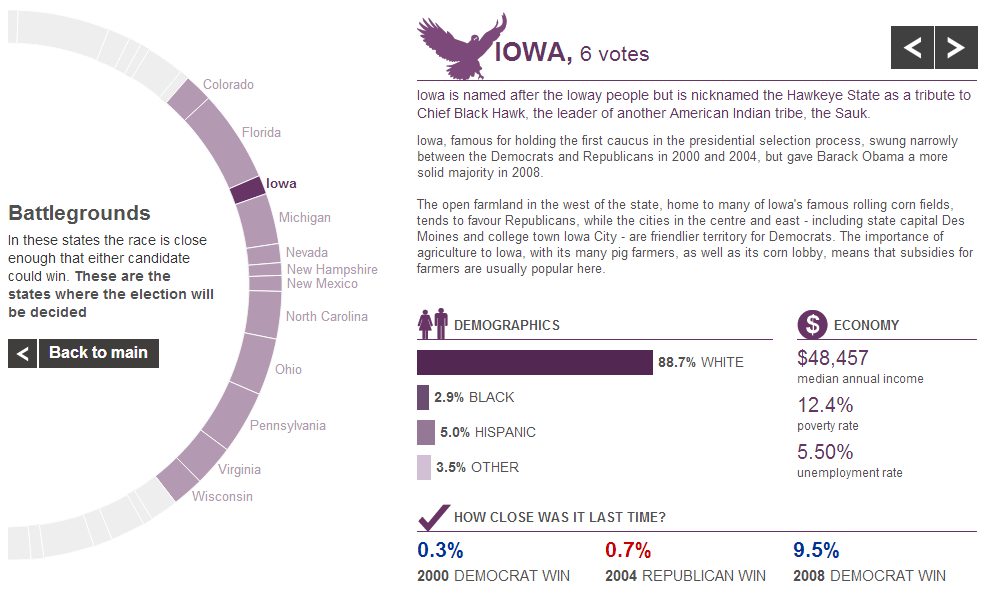
But the most impressive interactive election map award goes to the BBC’s detailed profiles of each of the US states. This map shows each State’s population, Electoral College votes, economic value, their demographic breakdowns, and which way they are expected to vote.


